
Part 1 showed that asset location produces modest results on a static portfolio. By simply organizing her existing assets efficiently, Olivia ended up with $21,230 more in after-tax wealth over 20 years on a $500,000 starting balance. For the 4% rule of thumb devotees out there, that works out to about $849 more per year in retirement spend. It is worth doing, but not something worth obsessing over.
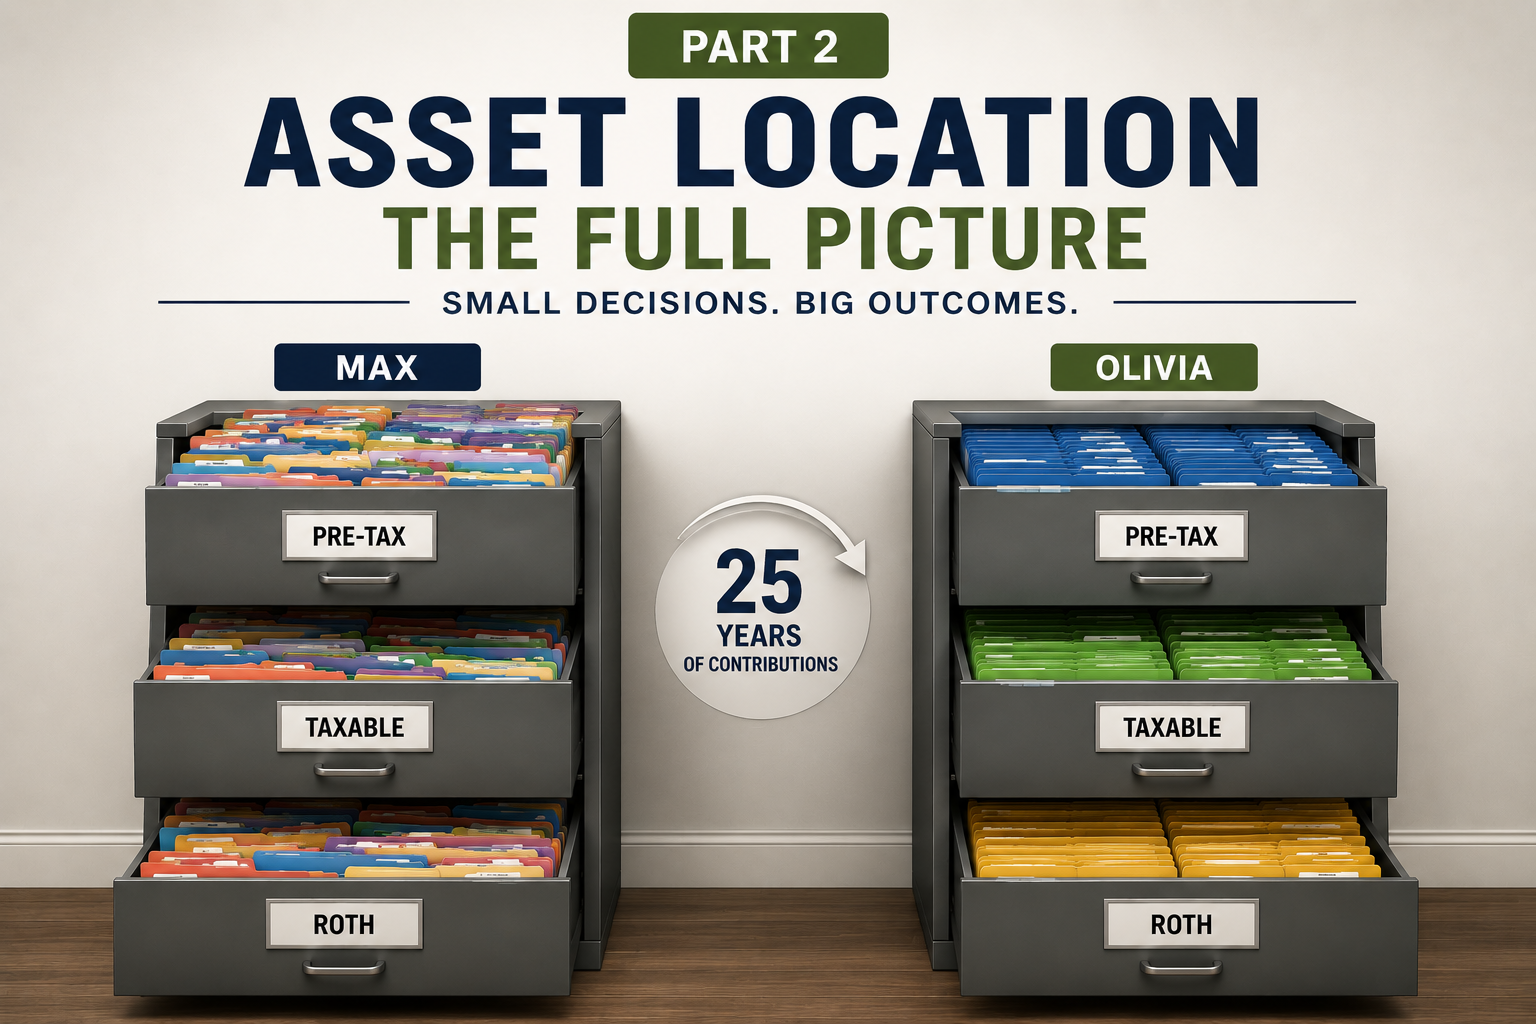
Now we are going to add a more realistic wrinkle to the analysis, and assume that our two savers are continuing to contribute to the accounts over the next 25 years.
The Setup
We are looking at the same two investors using the same logic, but over an extended timeline.
Max remains the mirror investor, holding a strict 70/30 split inside every account. Olivia remains the optimizer, packing her bonds into pre-tax and keeping nothing but equities in taxable and Roth.
Both start with the identical $500,000 portfolio from Part 1 ($350,000 pre-tax / $100,000 taxable / $50,000 Roth). This time, they both contribute $40,000 per year for 25 years, split across their accounts like this:
- Pre-tax: $23,000
- Taxable: $10,000
- Roth: $7,000
Both portfolios hold the exact same total dollars in stocks and bonds each year. The only difference is placement.
The market assumptions remain identical: 9% stock returns, 4.5% bond returns, and a 1.5% dividend yield. For taxes, we assume a 24% federal ordinary income tax rate on bond interest and 15% on dividends and capital gains.
What the Contributions Change
In Part 1, the taxable account starts at $100,000 and stays there. In Part 2, it grows by $10,000 every single year with contributions.
By year 25, Max has over $1.3 million sitting in his taxable brokerage account, and because he mirrors his allocation, a significant portion of that balance is holding bonds, which generate ordinary income tax bill year-after-year.
Olivia’s taxable account holds stocks only throughout the entire 25-year accumulation phase. Because of this, the tax drag gap widens dramatically as the portfolios grow.
| Year | Max’s Tax Drag | Olivia’s Tax Drag | Annual Savings | Cumulative Savings |
| 1 | $530 | $248 | $282 | $282 |
| 5 | $858 | $449 | $409 | $1,727 |
| 10 | $1,390 | $818 | $572 | $4,262 |
| 15 | $2,106 | $1,380 | $726 | $7,592 |
| 20 | $3,087 | $2,235 | $852 | $11,618 |
| 25 | $4,451 | $3,537 | $914 | $16,099 |
By year 25, Olivia is saving $914 per year in raw tax drag. Over the full multi-decade period, her cumulative tax savings total $16,099—nearly three times the savings we saw in Part 1.
The compounding effect of those early tax savings produces a gross portfolio gap that outpaces the sum of the tax drag savings alone.
Final Balances at Year 25
After adding $1,000,000 in total lifetime contributions over 25 years, the raw balances look quite different. Max’s pre-tax account ends up more than $486,000 larger because it housed a higher concentration of growth-oriented stocks. Conversely, Olivia’s taxable and Roth accounts outgrow Max’s by $323,902 and $180,347 respectively.
When you add everything up, Olivia’s total gross portfolio is $18,113 larger than Max’s. Notice how close that is to her $16,099 in cumulative tax savings. The extra couple of thousand dollars is simply the compounding effect of those early tax savings working in her favor over the 25-year timeline.
But gross numbers don’t tell the whole story.
After-Tax Is What Matters
Just like in Part 1, gross numbers can be deceiving. Max’s pre-tax account faces ordinary income tax rates upon withdrawal, while Olivia’s larger taxable account faces a capital gains bill.
To see what is actually spendable, we have to liquidate both portfolios using our standard retirement tax assumptions: 22% on pre-tax balances, 15% on taxable gains above basis, and 0% on the Roth accounts.
| Account (After Tax) | Max | Olivia | Difference |
| Pre-tax (After 22%) | $3,304,064 | $2,924,877 | ($379,187) |
| Taxable (Basis + Gains @ 15%) | $1,230,712 | $1,506,029 | +$275,317 |
| Roth (Tax-free) | $897,075 | $1,077,422 | +$180,347 |
| Total After-Tax | $5,431,851 | $5,508,328 | +$76,477 |
| At 4% SWR | $217,274/yr | $220,333/yr | +$3,059/yr |
Olivia retires with $76,477 more to spend. That represents roughly 7.6% of her total lifetime contributions, recovered entirely through deliberate asset placement. Using a standard 4% safe withdrawal rate, that extra cushion yields an additional $3,059 per year for the entirety of her retirement.
Keeping Perspective: Where Does This Rank?
An extra $76,477 in spendable retirement cash is a fantastic win for a series of simple organizational tweaks. But it is important to keep this number in context. Where does asset location sit in the grand hierarchy of personal finance?
While an optimized asset location clearly comes out ahead, it remains a secondary optimization. Your personal savings rate and core asset allocation (your overall stock/bond split) will always do the heavy lifting. Moving your stock allocation up or down by 10% or swapping high fee mutual funds for index funds will have a greater impact on your ultimate retirement timeline than asset location ever will.
The size of the benefit is also dependent on your bond allocation. Because Max and Olivia are running a 70/30 allocation, the ordinary income tax drag from that 30% bond bucket is significant. If you are a young investor running a 90/10 or 100% equities portfolio, your asset location benefit will be much lower because you have little to no bond interest to shelter. Conversely, if you are nearing retirement and holding a 50/50 or 60/40 portfolio, your tax exposure in a taxable account increases. The more fixed income you own, the bigger the deal asset location becomes.
The RMD Benefit
This after-tax snapshot still does not capture the full picture. Because Olivia prioritized holding her bonds in pre-tax, her traditional retirement account is much smaller than Max’s at retirement.
In the world of retirement planning, a smaller pre-tax balance can actually be an advantage. It means significantly lower Required Minimum Distributions (RMDs) starting at age 75.
For early retirees planning to execute Roth conversion ladders during their “bridge years” (the gap between early retirement and the start of Social Security and Medicare), a lower pre-tax balance is highly beneficial. It leaves more room to convert traditional balances to Roth at favorable lower tax brackets, while reducing the risk of large RMDs hitting later in life and pushing you into a higher bracket.
What To Do With This
- If you are currently in the accumulation phase: The takeaway is simple. Set up your asset location strategy now and stick with it. Direct your ongoing bond investments to pre-tax accounts, and prioritize your taxable and Roth contributions for equities. Every annual contribution that lands in the correct account adds to an optimization gap that compounds quietly in your favor for decades.
- If you hold standalone bonds in taxable with unrealized losses: This is highly likely if you’ve held pure bond funds over the last few years. In this case, the fix is easy: sell the bond funds to realize the tax loss, use those losses to offset other gains, and immediately buy the corresponding equity funds in your taxable account. Then, rebalance your pre-tax account to pick up the bond allocation. Just make sure to pick funds that are similar but not “substantially identical.” By making a few transactions, you can fix your asset location instantly and get a tax write-off in the process.
- If you hold Target Date Funds in taxable: This comes with a catch. Because a TDF bundles stocks and bonds together, the stock growth over the last decade will likely outweigh any recent bond losses, leaving you with a large net unrealized gain. Do not sell the TDF just to reposition. The immediate capital gains tax bill will likely take years to break even against the annual tax drag savings. Instead, leave the existing TDF alone, direct all new contributions to separate funds in their proper accounts, and let the portfolio’s allocation shift organically over time.
Conclusion: You Get to Choose
Now that we have looked at the full picture, you have a realistic view of exactly how much asset location matters over a lifetime of investing. Over 25 years of steady contributions, optimizing your asset location can save you tens of thousands of dollars in tax drag, ultimately putting an extra $76,477 of spendable cash in your pocket if your portfolio looks like Max and Olivia’s.
It is a meaningful win, but it is not a make-or-break strategy.
This brings us to the most important rule of personal finance: know yourself.
Managing a multi-account puzzle requires monitoring. Every time you rebalance, buy, or sell, you have to look at your portfolio as one unified spreadsheet rather than individual accounts.
If that kind of regular portfolio maintenance is something you know you won’t do, or frankly just don’t want to do, that is completely fine. The wealth built by consistently saving and maintaining your target asset allocation will always do the heavy lifting. The remaining benefit from asset location optimization isn’t worth the cost of analysis paralysis or getting overwhelmed.
So, for what it’s worth, you have permission to be a Max. If keeping a simple, mirrored 70/30 split across all your accounts keeps you invested and stress-free, that is a massive victory.
Just know that I’m an Olivia at heart.